You know that restless feeling when your agency calendar is full, but your confidence is not? Client calls, campaign reports, and team check-ins keep you busy, but somewhere in the back of your mind, there’s a question: are things moving forward or just moving in circles?
Many agency owners make the mistake of looking only at revenue to judge performance. Revenue tells you if money is coming in, but it doesn’t explain whether clients are happy, projects are profitable, or the pipeline is healthy enough to sustain growth.
That’s why looking beyond just agency performance metrics is so important. A metric tells you what happened, but a Key Performance Indicator (KPI) connects that number to long-term growth and stability. KPIs give you the context you need to make smarter, data-driven decisions instead of chasing surface-level wins.
In this guide, we’ll break down 11 marketing agency KPIs you should track every month to keep your finances stable, your clients satisfied, and your growth predictable.
TL;DR
- Revenue tells part of the story, but KPIs give a complete view of agency performance and growth.
- To ensure reliable financial planning, track financial KPIs like
- MRR (Monthly Recurring Revenue)
- Net Profit
- Revenue per Employee
- Forecast Accuracy
- To strengthen client relationships, track Client Health KPIs like
- Client Retention Rate (CRR)
- Churn Rate
- Client Lifetime Value (CLV)
- Net Promoter Score (NPS)
- To improve acquisition efficiency, monitor Sales and Acquisition KPIs like
- Sales Win Rate
- Customer Acquisition Cost (CAC)
- Leads-to-Opportunities Ratio
- Consistent reviews, clear ownership, and benchmarking turn numbers into actions that drive predictable growth.
Why KPIs Are Non-Negotiable for Agency Growth
Running an agency without clear KPIs is like managing client campaigns without tracking conversions.
According to a study of 300+ agencies from Predictable Profits, those that maintain structured performance metrics outperform peers: 74% of agencies that fully track KPIs grew their revenue year-on-year.
Business leaders often point back to Peter Drucker’s reminder. “If you can’t measure it, you can’t improve it.”

This principle will always apply to agencies. Without measurable performance signals, you don’t really know if your proposals resonate, your delivery meets expectations, or your clients are getting the value they’re paying for.
You may feel productive, but without the right signals, you won’t see where value is leaking. That’s why marketing agency KPIs aren’t optional; they’re the foundation of growth.
 To understand why they matter so much, let’s look at the core ways KPIs support agency performance:
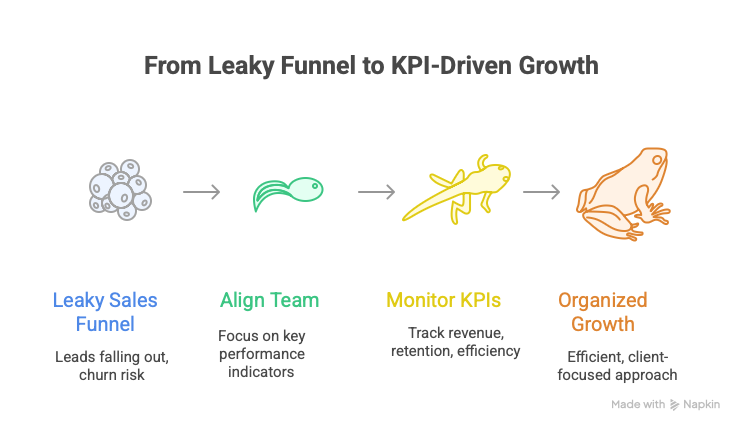
- Spotting Leakage in Processes
Every agency has hidden weak spots. Maybe leads enter the funnel, but few turn into opportunities, or profitable clients don’t get enough attention, while low-value accounts use up valuable time. Agency performance metrics help identify these gaps so you can act before revenue slips away
- Acting Before Problems Escalate
Think about client churn. By the time you notice several contracts ending, it’s often too late to save those accounts. KPIs serve as an early warning system. A climbing churn rate, a drop in client satisfaction scores, or declining project profitability all signal deeper issues such as a mismatch in expectations, weak onboarding, or under-delivery of results.
Bain & Company found that improving customer retention by just 5% can increase profits by 25–95%. That magnitude shows how early warning KPIs (churn, satisfaction) give you the leverage.
Agencies that track these signals can act before damage is done, strengthening long-term client relationships and protecting recurring revenue.
- Keeping Teams Aligned and Focused
Another reason KPIs are essential is alignment. In fast-moving agencies, it’s easy for sales, delivery, and account management teams to chase different priorities. One team might push for new clients at all costs, while another focuses only on retention. Without shared KPIs, you risk pulling in opposite directions. When everyone monitors the same agency metrics, teams stay aligned, performance becomes measurable, and leadership gains a clear, strategic view of the entire business.
- Measuring Efficiency, Not Just Activity
Busy doesn’t always mean being effective. Agency performance metrics help you see if the time and resources invested are truly paying off. Tracking indicators like billings per employee or project profitability shows whether your team’s hard work is creating sustainable growth instead of just keeping everyone occupied.
For example, agencies often target 70–80% utilization (billable hours) to stay healthy. If you place this expectation in place by way of a KPI, you’ll know when you’re slipping into a non-billable slack.
Financial Performance KPIs
You can’t run a healthy agency without knowing where your money comes from and how it’s being used. Client wins and busy schedules feel great, but without a strong financial footing, growth is never sustainable.
That’s why financial performance KPIs are some of the most important metrics your agency can track. They help you assess revenue stability, protect profit margins, and measure just how effectively your team drives financial outcomes.
Here are four financial KPIs every agency should review each month:
1. Net Profit (Of course)
This may sound like a no-brainer, but we’ve seen a fair amount of agencies sweep it under the rug. Net profit is the amount of money your agency actually keeps after subtracting all operating expenses from total revenue. It’s one of the most important financial KPIs because it shows whether your agency is truly profitable or just busy generating revenue.
If tracking this metric feels uncomfortable at first, making it part of your KPIs can help you get used to it, chase clear goals, and eventually turn it into an evolving target to work toward.
Formula: Net Profit = Total Revenue − Total Expenses
Why it matters:
- High revenue with low profit often means costs are out of control or services are underpriced.
- Net profit gives you a reality check on financial health and ensures growth is sustainable.
- Agencies with strong profit margins (often 15–20% in the industry) can reinvest in talent, tools, and marketing with confidence. But note: in more competitive markets or during growth phases, margins sometimes tighten to the 10–30% range.
2. Monthly Recurring Revenue (MRR)
Monthly Recurring Revenue, or MRR, is one of the most reliable financial KPIs for agencies. It represents the revenue you can consistently expect each month from long-term retainers, subscription-style services, or ongoing contracts. Unlike project-based work that may spike one month and dip the next, MRR gives you a predictable baseline to plan around.
For example, agencies that lean into recurring retainers saw 25% faster growth.
Read: Leveraging Retainers to Make Your Agency Revenue More Predictable
How to calculate MRR: MRR = Number of Paying Customers × ARPU (Average Revenue Per User per month)
Why it matters:
With a stable MRR, you can make confident business decisions. It allows you to predict cash flow, budget for expenses, and plan for growth activities like hiring or investing in new tools. It also protects you from the instability of one-off projects, where revenue may be high in one quarter and low in the next.
3. Billings per Full-Time Equivalent (FTE)
This KPI measures how much revenue each employee (or ‘contractor equivalent’) generates for your agency. It’s a key agency performance metric for understanding productivity and efficiency across your team (the pulse of your operations).
The basic formula for determining FTE is:
FTE = Total Hours Worked by Part-Time + Full-Time Employees/Full-Time Hours in a Year
Why it matters:
Billings per FTE helps you see whether your team is being used efficiently. A declining number can mean non-billable work is creeping up, client projects are underpriced, or workloads are unbalanced across departments. Tracking this metric regularly helps you manage staffing levels, identify training needs, and make smarter pricing decisions.
Top-performing agencies often generate around $225K in revenue per employee, while agencies in the tier below typically see an FTE closer to $150K. Tracking this metric lets you work backward to optimize pricing and staffing. For example, if your revenue per FTE dips below $120K, it’s a clear signal to adjust rates or team size.
4. Projected vs. Actual Revenue
The revenue you plan in the first meeting of the month is rarely what you’ll see sitting with you at the end.
This particular KPI compares the revenue you expected to earn in a given period (based on forecasts, proposals, or pipeline) with the revenue you actually earned. It helps agencies check the accuracy of their financial forecasts and spot gaps in sales or delivery performance.
Formula: Variance (%) = Actual Revenue – Projected Revenue/Projected Revenue × 100
Why it matters:
- Accuracy check: If you consistently miss projections, your pipeline assumptions or sales process are probably unrealistic.
- Cash flow planning: Overestimating can cause budgeting shortfalls, while underestimating may hold back investments in staff or tools.
- Strategic alignment: A close match between projected and actual revenue means your forecasting model is reliable, which strengthens planning for hiring, scaling, or entering new markets.
Client Health & Retention KPIs
Keeping the books balanced sure is important, but lasting success comes from keeping clients around. Winning a new account is exciting, but if too many leave after a few months, you’ll always feel like you’re starting over or stuck in that “getting to know you” phase.
That’s why client health and retention KPIs matter just as much as financial ones. These agency performance metrics show whether your clients are satisfied, loyal, and likely to stick with you for the long run.
Let’s look at four retention-focused KPIs every agency should keep an eye on each month:
5. Client Retention Rate (CRR)
Client Retention Rate measures the percentage of clients your agency keeps over a specific period. Yes, it’s that simple.
It’s one of the most important client health metrics because it reflects how satisfied clients are with your services and how likely they are to continue working with you. A consistently high CRR signals strong loyalty, reliable delivery, and long-term stability for your agency.
Formula: CRR (%) = Clients at End of Period – New Clients Acquired/Clients at Start of Period × 100
Why it matters:
Well, we touched on it, but retaining clients is more cost-effective than acquiring new ones. A strong retention rate lowers churn, reduces sales pressure, and creates more opportunities for upselling and cross-selling. Agencies with high CRR enjoy consistent revenue and stronger client relationships, both of which are important for predictable growth.
Most professional service firms aim for retention rates between 70%–90%, according to AgencyAnalytics. If your CRR dips under 80%, it’s a warning. Run a post-mortem on lost clients to isolate the cause.
6. Churn Rate
Churn rate is the percentage of clients your agency loses during a set period. Think of it like a mirror image of your retention. A rising churn rate often signals deeper issues, such as weak onboarding, poor communication, or clients not seeing enough value from your services.
Formula: Churn Rate (%) = Clients Lost During Period/Clients at Start of Period × 100
Why it matters:
Even small increases in churn can quickly eat into recurring revenue, forcing your sales team to work harder just to stay in the same place. By analyzing client engagement and performance signals, tools like Synup OS highlight accounts that may be at risk; for example, a client whose review responses or campaign logins suddenly drop off.
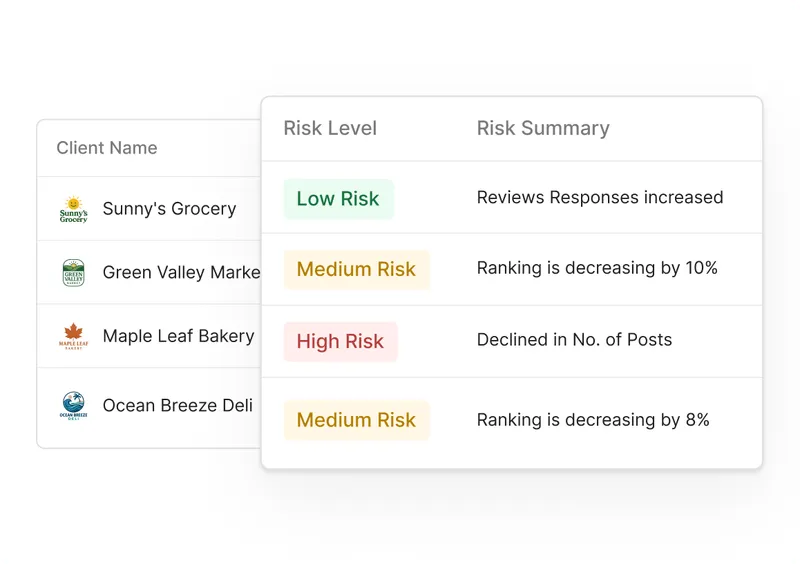
With that early warning, you can step in, re-engage the client, and protect the relationship before it turns into lost revenue.
Learn: 7 Fixes to Reduce Client Churn for Your Agency
7. Client Lifetime Value (CLV)
Client Lifetime Value, or CLV, estimates the total revenue a client is expected to generate over the course of their relationship with your agency. This is a valuable metric because it links client retention directly to long-term profitability.
Formula: Average Revenue Per User (ARPU) / % of Annual Churn
Why it matters:
A high CLV means your clients see ongoing value in your services and stay with you longer. This directly impacts profitability, since retaining a client for years is far cheaper than constantly replacing them with new ones. It also helps you make smarter marketing and sales decisions.
Tracking CLV with retention and churn gives you a complete picture of how well your agency is building long-term client relationships and how much revenue you can realistically expect from each account.
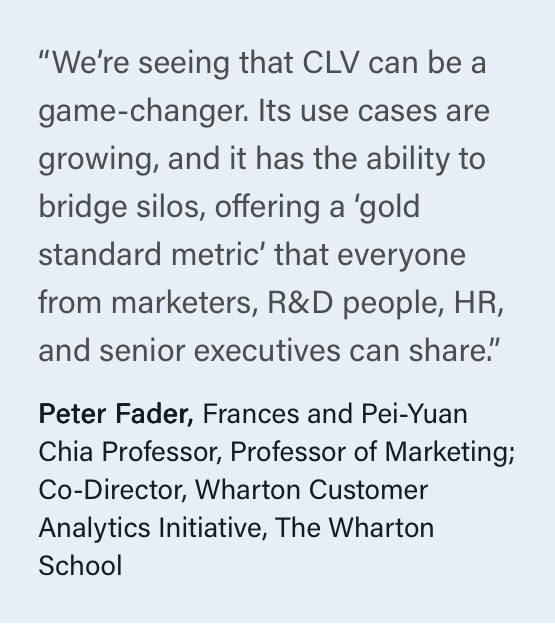
As Peter Fader from Wharton highlights, CLV isn’t just a financial metric; it’s a “gold standard” measure that unites marketers, HR, and leadership.
8. Net Promoter Score (NPS)
Net Promoter Score (NPS) is a simple metric that shows how satisfied and loyal your clients are. It is measured by asking clients to score, on a scale from 0 to 10, how likely they are to recommend your agency. Their responses are then grouped into three categories:
- Promoters (9–10): Enthusiastic supporters who are likely to stay longer and refer to new business.
- Passives (7–8): Neutral clients who are generally satisfied but could be swayed by competitors.
- Detractors (0–6): Unhappy clients who may leave and potentially harm your reputation.
Formula: NPS = Total % of Promoters − Total % of Detractors
Why it matters:
A consistently high NPS indicates strong relationships and the potential for referrals, while a low or falling score can signal deeper problems like poor communication or unmet expectations.
For agencies, an NPS above 30 is generally considered strong, and anything above 70 is excellent. By tracking NPS regularly, you get a clear sense of how clients feel about your agency, beyond just contracts and invoices.
Sales & Acquisition KPIs
Generating the best leads is one thing; going after them with the right pitch and turning them into profitable and long-lasting clients is another. That’s why sales and acquisition KPIs are so important for agencies.
These metrics give you clarity on how well your sales process is working, how efficiently you’re spending to acquire clients, and whether your funnel is actually healthy. Here’s what to look at:
9. Sales Win Rate
Sales win rate measures the percentage of proposals or pitches that end in a signed contract. It gives you a clear picture of how effective your sales team is at moving prospects from “interested” to “committed.”
Formula: Sales Win Rate (%) = Number of Deals Won/Total Qualified Opportunities × 100
Why it matters:
Your win rate shows whether you’re chasing the right opportunities. A low win rate may mean proposals are off-target, leads aren’t qualified, or your pricing doesn’t match the market. A strong win rate indicates you’re reaching the right prospects and delivering pitches that resonate. Tracking this regularly helps agencies improve proposals and focus on the clients most likely to close.
However, there is a catch. If your win rate is extremely high (e.g., > 50%), that may indicate you’re only pursuing very safe deals and missing growth opportunities. An overly generous win rate can mask pipeline issues.
10. Customer Acquisition Cost (CAC)
Customer Acquisition Cost (CAC) tells you how much your agency spends to acquire a new client. It includes all the costs associated with marketing and sales, from ad campaigns and software subscriptions to sales team salaries, events, and outsourced support.
Formula: CAC = Total Sales and Marketing Costs/Number of New Clients Acquired
Why it matters:
CAC demonstrates whether your growth is financially sustainable. It’s not enough to win clients if you’re overspending to get them. To make this metric meaningful, always compare it with Client Lifetime Value (CLV). Ideally, your CLV should be at least three times higher than your CAC (a 3:1 ratio). Some high-growth SaaS firms even aim for 4:1 or 5:1. A high CAC compared to CLV means your agency is spending nearly as much to win clients as it earns from them.
Regularly tracking CAC helps agencies set realistic marketing budgets, evaluate which channels bring in the most cost-effective clients, and ensure the business scales profitably rather than just growing for growth’s sake.
11. Leads to Opportunities
Sure, not every lead is worth pursuing, but you gotta remember that every paying client starts as a lead.
This KPI tracks how many of your initial leads progress into qualified opportunities that align with your target profile, show genuine interest, and are prepared for a sales conversation. It highlights the efficiency of your funnel and helps you understand if your marketing efforts are generating the right kind of leads.
Formula: Leads to Opportunities (%) = Qualified Opportunities/Total Leads Generated × 100
Why it matters:
A low lead-to-opportunity ratio often indicates that something isn’t working as it should, whether it’s lead quality, nurturing, or sales alignment. For example, generating 200 leads in a month might look impressive, but if only 10 of them turn into opportunities, your funnel is leaking.
In B2B contexts, a solid lead-to-qualified-opportunity rate often ranges between 5–15%. Anything below 5% suggests weak qualification or funnel alignment issues.
Tracking this KPI allows you to pinpoint where those leaks occur and make adjustments, such as refining lead qualification criteria or improving follow-up processes.
A healthy leads-to-opportunities ratio means your sales team can spend less time chasing unqualified prospects and more time engaging with clients who are genuinely likely to convert.

How to Track and Measure Your KPIs
Tracking numbers is simple. The hard part is knowing what those numbers actually mean for your agency and how to act on them. Too often, KPIs end up buried in reports without driving any real change. When tracked and reviewed properly, KPIs become a decision-making tool rather than just another set of unused numbers. To make KPIs work for you, you need a clear process.
Let’s look at the ways that will help you measure them effectively and turn insights into action:
1. Set a Regular Review Cadence
The first step is consistency. Some KPIs move quickly and need weekly reviews, such as churn signals or sales win rate. Others, like net profit or billings per FTE, are better suited for monthly reviews because they reflect overall financial health. Decide on a cadence for each metric and stick to it. When you review KPIs at the same interval, you can identify patterns, spot risks early, and avoid reacting impulsively to minor fluctuations.
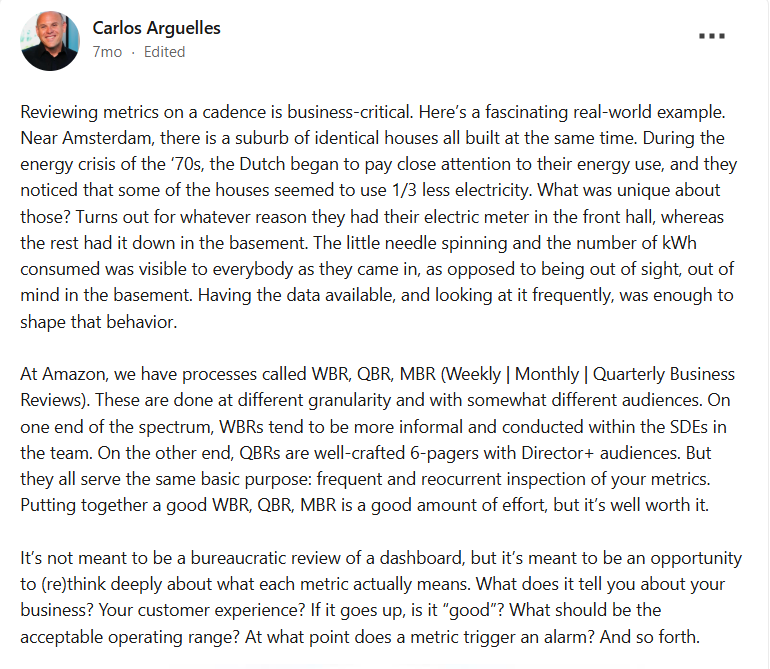
Amazon’s teams follow a disciplined process for reviewing metrics regularly. The same framework can be easily adapted to suit an agency’s goals and operations.
2. Select the Right Tools for Tracking
The tool you use to monitor KPIs should match your agency’s size and complexity. Smaller teams often start with spreadsheets because they are flexible and inexpensive. As you grow, manual updates become inefficient and error-prone. This is where KPI dashboards and marketing agency platforms provide value. Automated systems like Synup OS unify client, sales, and financial KPIs into one view, giving leaders real-time visibility without juggling multiple tools.
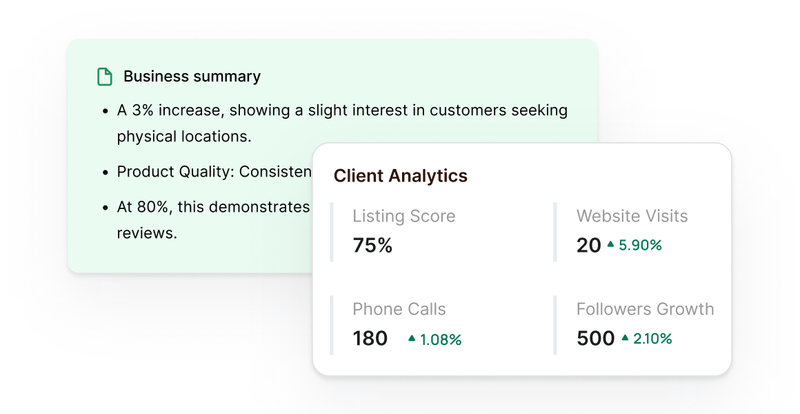
The easier it is to access accurate data, the more likely your team is to actually use it.
3. Assign Ownership and Drive Action
KPIs only create impact when someone is accountable for them. Each metric should have a clear owner who monitors results and suggests improvements. For example, a sales manager can track win rate, while a client services lead monitors NPS and retention. Once ownership is set, use the data to guide action. If CAC is rising, adjust acquisition channels. If retention is falling, improve onboarding or client engagement. The goal is to turn numbers into strategies that boost client satisfaction and profitability.
4. Benchmark and Recalibrate Regularly
Tracking KPIs without comparison only tells part of the story. To know if your agency is truly performing well, compare your metrics against industry benchmarks or your own past performance. For example, if your churn rate is lower than the industry average, that’s a strength to build on. If your CAC is higher than peers, it’s a sign you need to refine acquisition strategies. Regular benchmarking keeps your goals realistic and ensures you adjust targets as your agency grows.
Conclusion
You can’t just throw stuff at the wall and hope it sticks (at an agency). You’ve got to throw it strategically, at the right time, toward the right goals, and actually track what happens next.
An agency’s real story is told by KPIs that track profit, client retention, lifetime value, acquisition cost, and team efficiency. When you consistently review these numbers, assign ownership, and take action, you stop guessing and start leading with clarity.
To make this easier, Synup OS gives you the tools to monitor retention, revenue, and acquisition costs without switching to multiple systems. It was built to help agencies act on their KPIs, not just record them.
Book a demo and see how Synup OS can help you put these metrics into practice and grow with confidence.
Frequently Asked Questions (FAQs)
1. What’s the difference between leading and lagging KPIs for agencies?
Leading KPIs are predictive metrics that give you early signals about future performance, such as how many leads are turning into opportunities or whether churn risk is rising. Lagging KPIs, on the other hand, measure what has already happened, like net profit or client retention. Agencies need a mix of both to anticipate problems and measure outcomes accurately.
2. How often should agencies review their KPIs?
The review frequency depends on the metric. Fast-moving indicators like churn signals or sales win rate work best with weekly reviews, while financial KPIs such as profit or billings per FTE are more effective when tracked monthly. The key is consistency rather than speed.
3. Can small agencies track KPIs without investing in expensive software?
Yes. Smaller teams can start with spreadsheets or free tools to log and review KPIs regularly. As the agency grows, dashboards or platforms like Synup OS save time by automating data collection and providing real-time insights, but manual tracking is a good first step.