
When starting out as a small agency, you keep client details in your head. But when managing 100-300+ SMB locations at $150 a pop, even the finest effort in “remembering” doesn’t scale.
If a strategist forgets that a multi-location dental group prefers to be billed per clinic rather than via a corporate invoice, or if they miss the fact that a client’s GMB listing was suspended three days ago, your churn rate will spike.
The difference between a 2% and 5% monthly churn is the difference between a profitable agency and one slowly dying. Managing client data effectively is the only way to tighten those margins. And the solution is moving toward a single source of truth: a system that acts as a Customer Data Platform (CDP); as a live environment where you can see health scores, contract dates, and performance metrics in one place.
TLDR: The Agency Strategy for Data-Driven Growth
- Centralize with the Client Table: Ditch the “spreadsheet nightmare.” Use Synup’s Client Table as your command center to track location counts, active products, and assigned reps in one grid.
- Search & Accountability: Use the Search Bar for instant access during client calls and assign Primary Representatives to every account to ensure clear internal ownership and stop things from falling through the cracks.
- Customize Your Workspace: Tailor your view by toggling columns to show only the metrics that matter to your niche. Use Custom Fields to track agency-specific data like “CMS Type” or “Contract Value.”
- Automate Research with AI: Leverage AI-Enriched Fields to automatically pull NAICS codes, employee counts, or competitor data, turning your database into a high-level consulting tool without the manual labor.
- Tactical Tagging: Group clients by industry (e.g., “Dental”), risk (e.g., “At-Risk”), or plan type. This allows for Bulk Actions and targeted “save” or “upsell” campaigns that feel personalized but scale easily.
- Active Health Monitoring: Use the Client Summary to track Social, SEO, and Review scores. Configure Risk Overview triggers to get an early warning when a client’s performance dips, allowing for proactive intervention.
- Client Portal Transparency: Use the Files tab to store deliverables and toggle portal access. Giving clients 24/7 visibility into their assets builds the trust necessary for long-term retention.
- Maintain Data Hygiene: Implement quarterly audits and standardized naming conventions. Clean data is the foundation of a professional operation and provides the documented proof of value needed.
Centralize Your “Source of Truth”: Moving Beyond Spreadsheets
If your team is still digging through Google Sheets to find out which representative is handling the “Main Street Pizza” account, you have a bottleneck.
Scattered data leads to missed renewals, forgotten tasks, and a customer experience that feels disjointed. To scale past 10 employees, you need a command center.
In Synup OS, the Client Table is that command center. It’s like the air traffic control tower for your agency. It’s a dynamic grid that lets you see the pulse of your entire book of business.
You can see location counts, active products, and who on your team is responsible for what, all without opening multiple tabs.
Accessing the Client Table
Getting started is straightforward. Once you log in to your Synup OS account, look at the left-hand navigation menu and click on Clients.
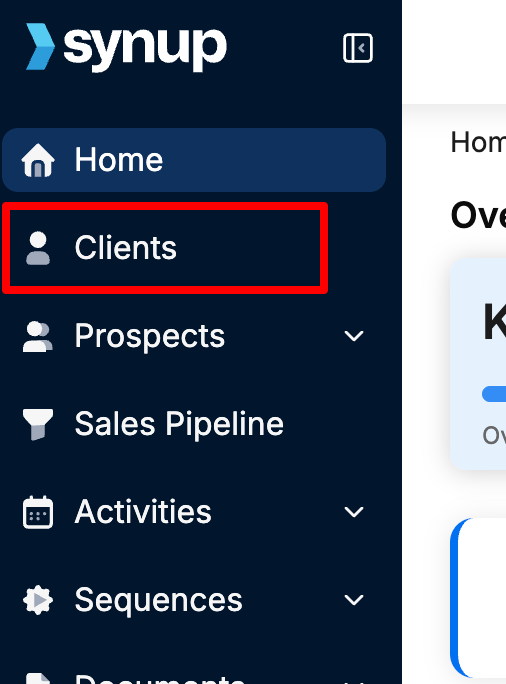

Source: Synup Support
The Client Table loads a structured grid where every row is a client, and every column is a data point. This is where your operational hygiene begins.
Quickly Searching for a Client by Name
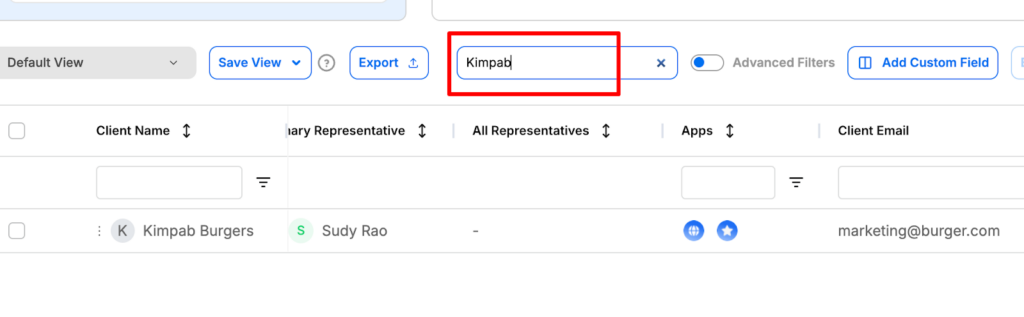

Source: Synup Support
Using the search bar at the top of the table, start typing the brand name and the list filters in real-time. This is a lifesaver when you’re on a live call and need to pull up an account before the client finishes their sentence.
Assigning Representatives to a Client
If a client churns, you need to know who was steering the ship. In the Client Table, you’ll see a Primary Representative column. You can also add multiple reps if you have a specialist for SEO and another for social.
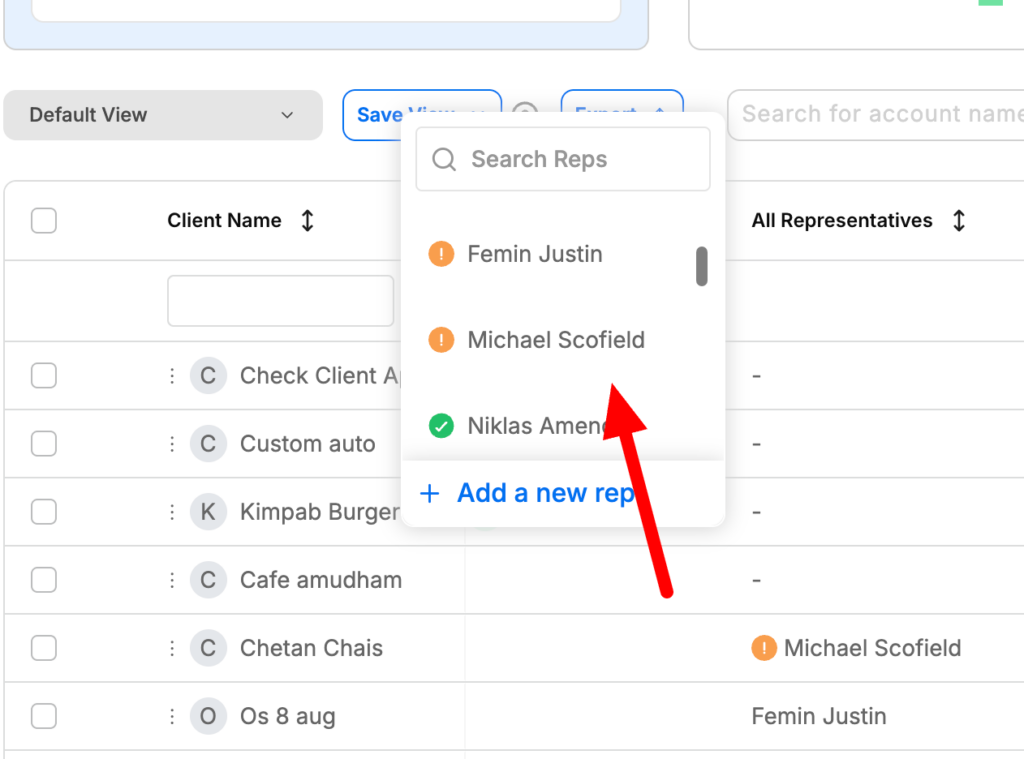

Source: Synup Support
- Click the placeholder in the column.
- Select the team member from the dropdown.
- The system saves it instantly. If a name is missing, you just jump into your team settings to add them. This ensures every client has a “human” attached to their data.
Customizing Your Table Columns
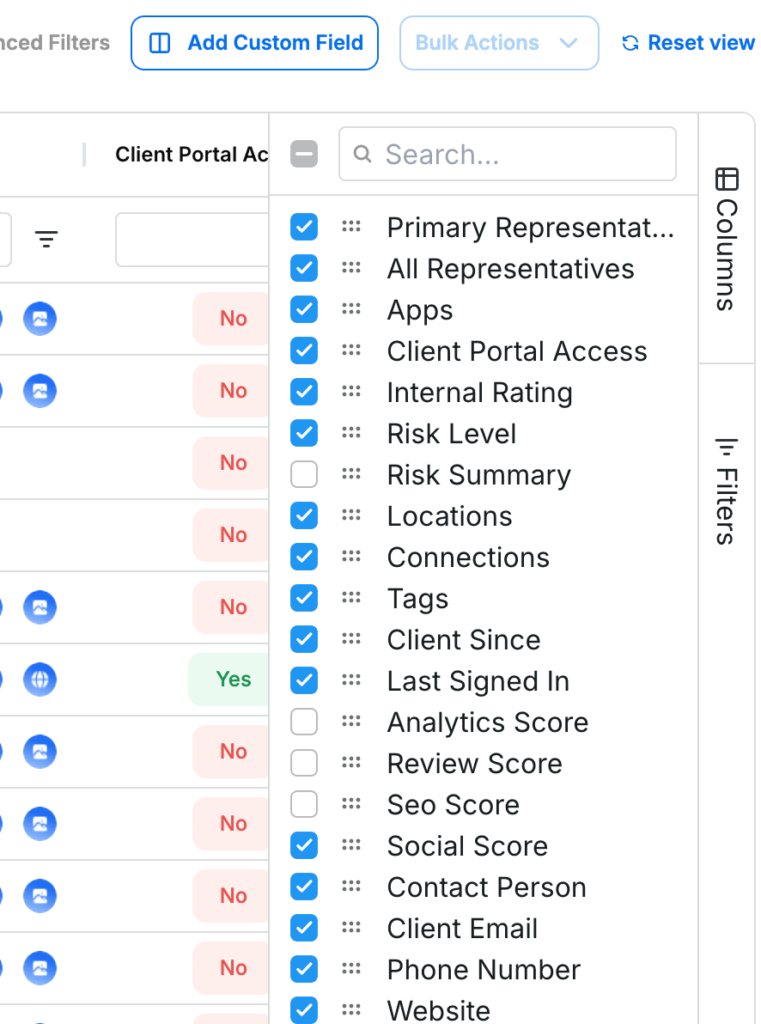
Not every agency cares about the same data points. Maybe you prioritize “Review Count” over “Date Added.” You can change the view by clicking the Columns icon at the top-right.

Source: Synup Support
You can toggle columns on or off and drag them to reorder the list. Plus, if the standard columns don’t fit your needs, you can use custom fields to track things like “Contract Value” or “CMS Type.“
Applying Filters to Narrow Your View
Filters allow you to cut through the noise. If you want to see only your high-risk clients in Chicago who are using your Reputation Management app, you can do that in three clicks.
- Hit the Filters button.
- Choose your criteria (e.g., Risk Level: High).
- Watch the table update. This helps you prioritize your morning. Instead of looking at 200 clients, you look at the 5 who actually need your attention today.
Using Advanced Filters with AND/OR Conditions
Sometimes basic filters aren’t enough. You might need to find clients who are “Small” (1-10 locations) AND use a Gmail address, OR clients who are “Large” (100+ locations). Using the Advanced Filters builder, you can set these logic gates.


Source: Synup Support
This is perfect for targeted outreach or identifying segments for a new service upsell.
Saving a Filtered View for Later
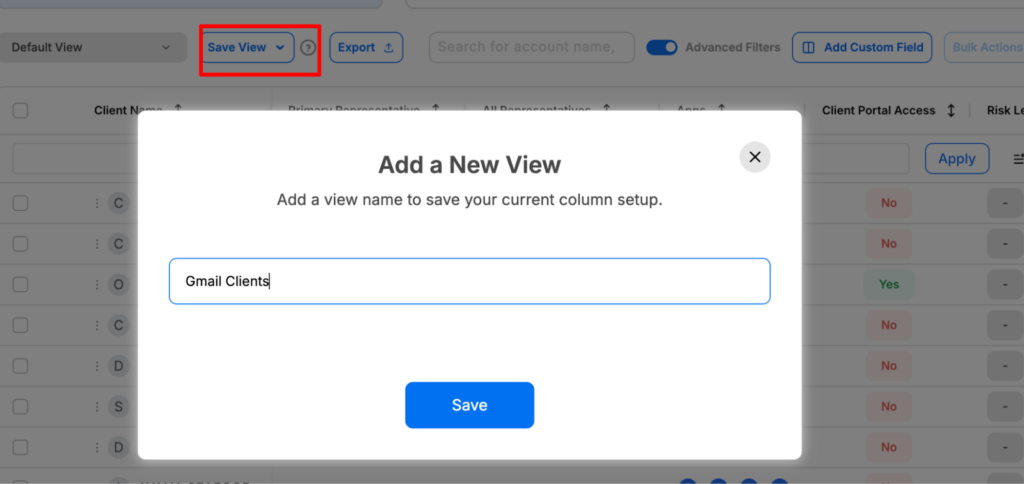
Don’t repeat yourself. If you check on “At-Risk Dental Clients” every Tuesday, save that view. Once you’ve set your filters, click “Save View” and name it.

Source: Synup Support
Next time, just select it from the dropdown. It’s about reducing the friction of finding information.
Performing Bulk Actions Across Multiple Clients
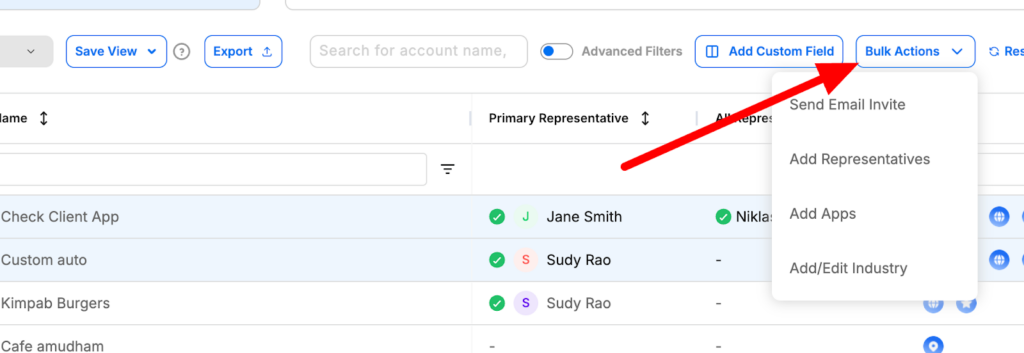
If you need to reassign fifty clients from a departing employee to a new hire, don’t do it one by one. Check the boxes on the left, hit “Bulk Actions,” and update the representative for all of them at once.

Source: Synup Support
Along with that, you can use bulk actions to update account details or remove old test accounts in seconds.
Customizing Data Storage: Tracking What Matters to You
A generic CRM doesn’t care about a client’s NAICS code, their “Google Map Pack” ranking history, or whether they use a specific POS system like Toast or Square. But for a local marketing agency, this data is the difference between a regular campaign and one that actually converts.
Using Custom Fields in Synup allows you to transform a basic profile into a deep intelligence report. Plus, the integration of AI fields means you don’t have to pay a VA (Virtual Assistant) $10 an hour to manually hunt for this data.
You can use AI to fill in the blanks, which is a massive time-saver. Instead of having an intern Google “What is the NAICS code for this plumber?”, the platform can do it for you.
How to Add a Custom Field in Synup OS
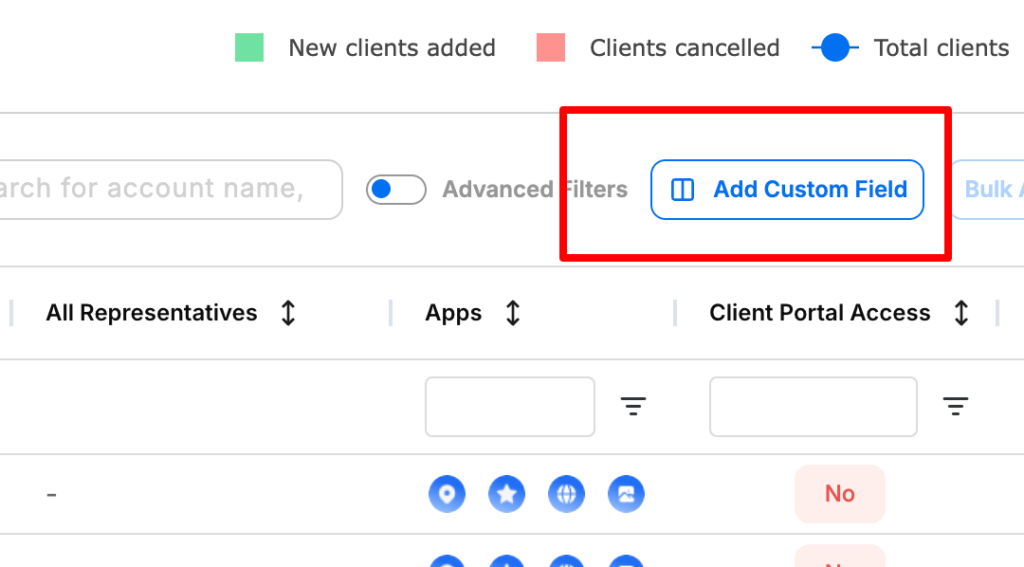
To make the data your own, you can add a custom field in Synup OS. Start by navigating to the Client Table and clicking “Add Custom Field.”

Source: Synup Support
You can also find this in the Settings icon on the top right.
- Name your field: Be specific (e.g., “Main Competitor”).
- Select Type: Choose from Text, Number, Date, or even an Attachment for contracts.
- Group it: Put your “Finance” fields in one group and “Technical” fields in another. This keeps the client profile clean.
Creating an AI Custom Field
AI fields act like a research assistant that never sleeps. You define a prompt, and Synup AI populates the data for you.
- Toggle the “AI Field” option during creation.
- Give it a rule, like “Find the official NAICS code for this business.”
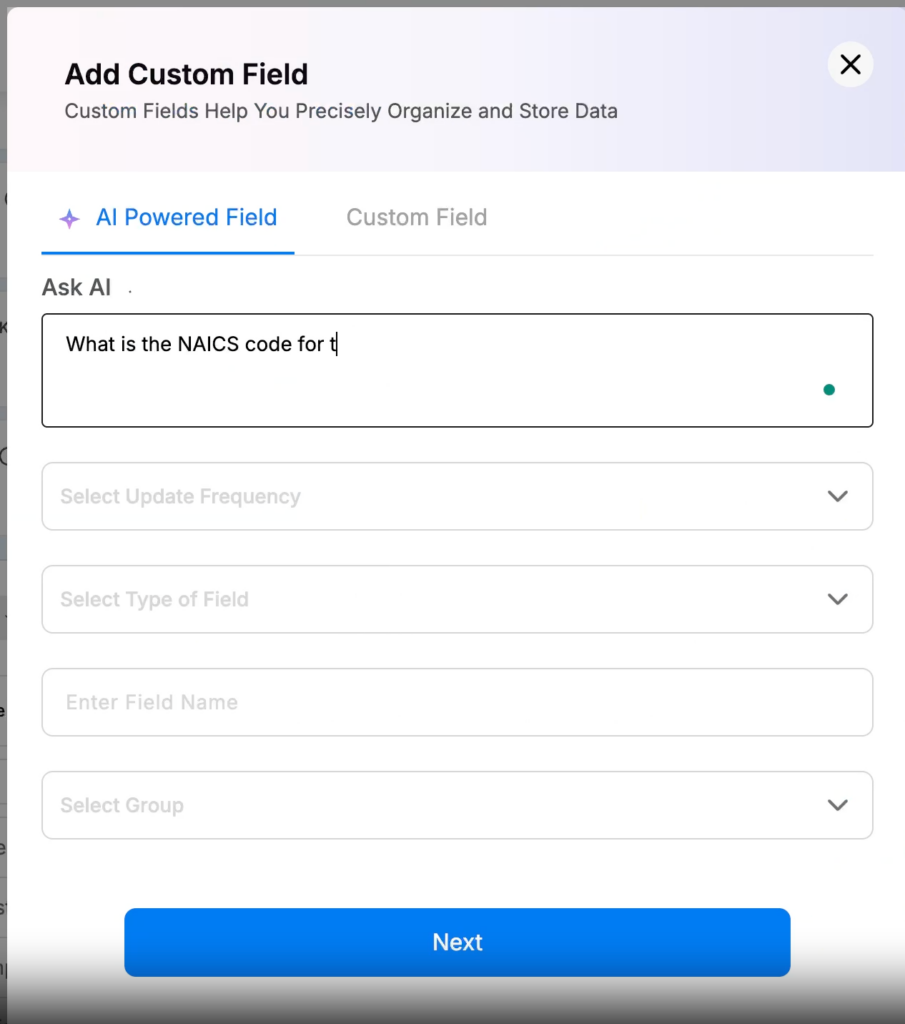

Source: Synup Support
- Choose the update frequency (monthly or quarterly).
- The AI will scan and populate that field for all your clients automatically. This turns your client list into an enriched database. When you know a client’s employee count or revenue tier without asking them, you look like a much more prepared partner. It also helps you justify how to raise your prices without losing customers because you can segment your value based on their actual business size and growth.
Segmentation and Organization: The Power of Tagging
Tags are the “sticky notes” of the digital age, but much more organized.
You don’t have to treat every client the same way. Tagging is the mechanism that allows you to provide “personalized service at scale.”
If you have 200 clients, you can’t write 200 different newsletters. But you can write one newsletter for your “Plumbing” tag and another for your “Dentist” tag. Here’s how to use tags to manage your client data in Synup OS:
Create a New Tag
You can build your tagging system through the Tag Manager in Settings or right from the Clients dashboard. If you’re looking at a client and realize they belong in a new “Q4 Promo” group, just click the dropdown in the Tags column and hit “Create Tag.”


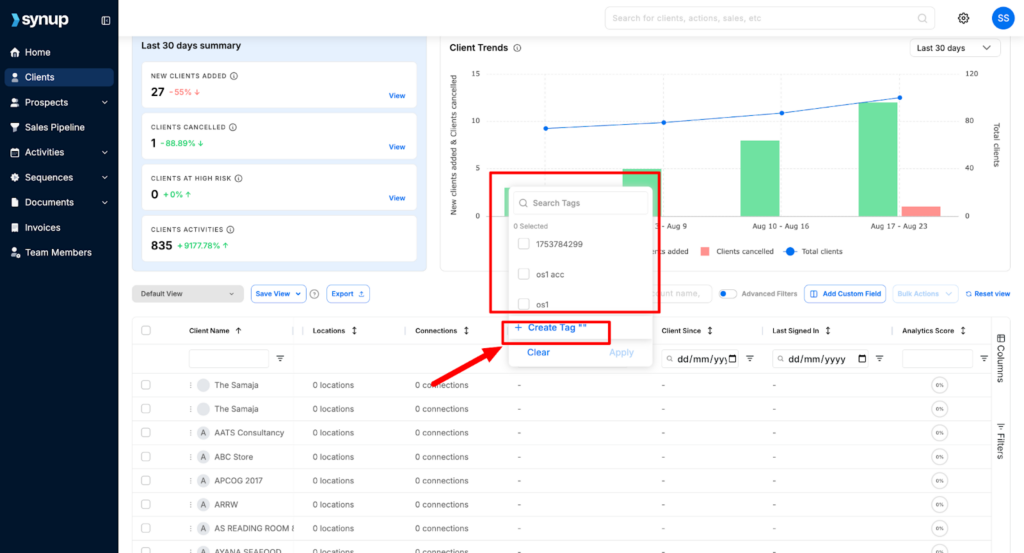
Source: Synup Support
Strategic Tagging Ideas
Don’t just tag for the sake of it. Use tags that drive action:
- Status Tags: “Onboarding,” “Active,” “At-Risk,” “Lapsed.”
- Industry Tags: “HVAC,” “Real Estate,” “Medical.”
- Value Tags: “VIP,” “Low Margin,” “Upsell Candidate.”
- Renewal Tags: “Jan-Renewal,” “March-Renewal.”
By using these tags, you can instantly filter your table to see all “At-Risk” clients in the “Medical” field. This allows you to send a very specific, personalized video message to that group, increasing the chances of retention.
Active Monitoring: Turning Data into Decisions
Storing data is a waste of time if you never look at it. You need to move from passive storage to active monitoring. The Client Summary view in Synup is designed to give you a “Pulse Check” in under sixty seconds. When a client calls out of the blue, this is the page you should have open to view a summary.
Navigating the Client Summary
When you click a client’s name from the table, you enter their Summary.
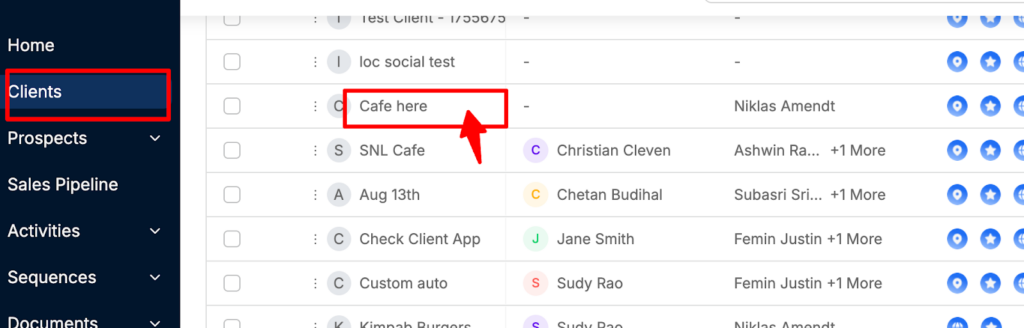

Source: Synup Support
This is a centralized dashboard with tabs for Overview, Apps, Notes, Files, and Invoices.
- Business Insights: This section is the most important for retention. You’ll see scores for Social, SEO, Reviews, and Profile strength. If the SEO score is trending down (indicated by a small red arrow), you know you need to take action before the client notices.
- Risk Overview: This card shows churn risk based on the criteria you set. You can click the gear icon to customize what “at-risk” means for a specific client. For a local plumber, maybe it’s a drop in review ratings. For a lawyer, maybe it’s a drop in profile views.
- Custom Fields (AI & Manual): This is where all those bespoke data points live. You can see the AI-generated revenue data right next to the manual notes about their “Founder’s Name.”
Managing Deliverables
The Files tab within the Summary is also great for transparency.
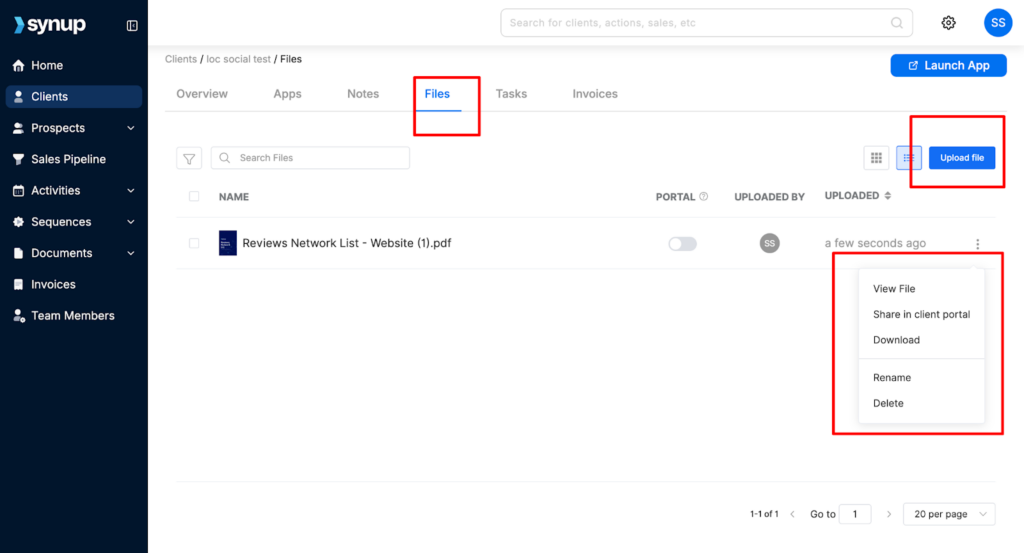
Source: Synup Support
You can upload a PDF report and toggle a switch to make it visible in the Client Portal. This eliminates the “Where is that report you sent?” emails.
It also builds trust. If they can see the work and the data in their own portal, the value is undeniable.
Best Practices for Maintaining Agency Data Hygiene
Data hygiene is like brushing your teeth: if you don’t do it daily, things start to decay.
In an agency with 10+ people, data quality tends to degrade. One person leaves a field blank, another uses a nickname instead of a legal business name, and suddenly your database is a mess.
A messy database leads to “zombie clients” who are still in your system but stopped paying months ago, or missed opportunities for upsells.
1. Regular Audits
Set a recurring task for your Operations Manager to do a “Data Scrub” every 90 days. During this time, they should:
- Archive any clients that are no longer active.
- Check for missing tags.
- Ensure every client has an assigned representative.
- Review “At-Risk” flags to see if the status has changed.
2. Standardize Input
Nothing ruins a database faster than inconsistent naming. If one person tags a client as “Medical” and another uses “Healthcare,” your filters won’t work.
Create a “Tag Dictionary” in your internal wiki. Not just that, make sure everyone knows which custom fields are mandatory during the onboarding process.
3. Security and Access
As you grow to 10+ employees, not everyone needs to see everything. Use custom roles to ensure that an intern can’t accidentally delete an entire client’s history or see sensitive financial data.
Keeping your data secure isn’t just a best practice; it’s a requirement for staying professional as you scale.
4. Use the Data to Drive Revenue
Finally, use this data to lead. If your Client Table shows that 40% of your HVAC clients have a “Review Score” below 3.0, you have just found a perfect opportunity for a reputation management upsell campaign.
Data isn’t just for looking backward; it’s for finding the path forward.
By centralizing your information, customizing your tracking, and actively monitoring health scores, you move from being a reactive agency to a proactive partner.
You stop wondering where the information is and start using it to grow.
5. Using the Data to Predict Churn
Look at your “At-Risk” clients over the last six months. Do they share a common thread? Perhaps they all have a “Profile Score” below 70%.
If you notice this pattern, you can create a rule: any client whose Profile Score drops below 75% gets an automatic “Health Check” task assigned to their representative. This is moving from a reactive agency to a predictive one.
Here are more ways to use the data for growth:
- Upsell by Industry: You can, for instance, filter for all “Plumbing” clients. Check which ones don’t have the “Social App” active. Send a bulk email showing a case study of how one plumber got 5 leads from Instagram last month.
- Referral Campaign: Filter for “Status: Active” and “Internal Rating: 5 Stars.” These are your advocates. Ask them for a referral in exchange for a one-month discount.
- The “Inflation” Adjustment: Filter by “Onboarding Date” more than 2 years ago. These clients are likely on underpriced legacy plans. Use the stored performance data to show them their growth and move them to your current rates.
- Multi-Location Expansion: Search for clients where Location Count > 1 but Location Count < 5. These are growing businesses. Set a task to ask them about their expansion plans for the next year.
- Re-Engagement: Filter for “Status: Inactive” but “Risk Level: Low” from a year ago. These were “good” departures (e.g., budget cuts). Reach out with a “We miss you” offer.
- Google Map Pack Focus: Use the SEO scores to find clients who are on the “verge” of the top 3 (ranking 4th or 5th). Offer a one-time “Map Pack Boost” sprint.
- Review Gaps: Find clients with a high “Profile Score” but a “Review Score” under 4.0. Sell them a specialized review generation campaign.
- Technical Debt: Use the “Website CMS” custom field to find all clients on old, slow platforms. Pitch them a migration to your high-speed hosting or a site rebuild.
- Holiday Promos: Use location data to find clients in specific cities and offer a “Local Holiday Blitz” social media package.
- Competitor Conquesting: Use the AI fields to identify a client’s main competitor. Show the client the data on how that competitor is out-ranking them in specific categories and offer a strategy to flip the script.
The Cost of Dirty Data
Suppose your average location fee is $150. If your data is so messy that you forget to bill for just 3 locations across your entire portfolio, you’re losing $450 a month or $5,400 a year.
If your team is using the wrong “Primary Rep” names, tasks get sent to the wrong people, leading to a 48-hour delay in client response times.
Conclusion
Effective client data management is about building a foundation that allows you to scale using a proven system. When your team has a single source of truth, they spend less time searching and more time strategizing. This efficiency directly impacts your bottom line, reducing the overhead cost per location and allowing you to maintain higher margins.
FAQs
1. What is client data management?
It is the process of collecting, organizing, and securing all information related to your agency’s clients. This includes contact details, performance metrics, project history, and communication logs. For an agency, it means having a “Single Source of Truth” so that any team member can understand a client’s status instantly.
2. How does a CDP differ from a CRM?
A CRM (Customer Relationship Management) tool focuses on the sales pipeline and basic contact info. A CDP (Customer Data Platform) for agencies, like the one integrated into Synup, pulls in real-time performance data, app usage, and health scores. While a CRM tells you who the client is, a CDP tells you how the client is performing.
3. What is a CRM database example?
A typical example for a local marketing agency would be a database that stores the business owner’s name, their multiple business locations, the specific SEO and Social services they pay for, their monthly budget, and their “Risk Level.” In Synup, this is visualized through the Client Table, where you can see all these disparate data points in a single, filterable grid.

